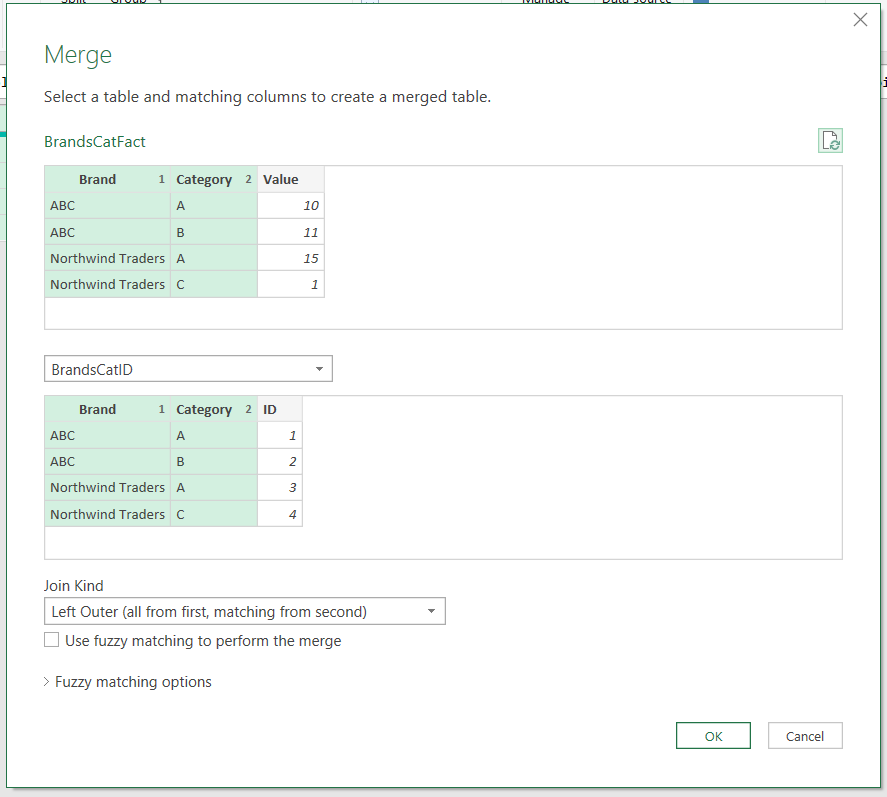
Performing joins with logic conditions like less than or greater than in Power Query can be challenging using the Power Query UI.

For example, in SQL it would be very easy:
SELECT * FROM A
INNER JOIN B on A.column1 <= B.column1
However, Thanks to @Alessandro, I discovered how to overcome this limitation by using the Table.AddColumn and Table.SelectRows functions available in M, the language of Power Query.
Let’s take a look at an example use case where we want to calculate the Year-to-Date (YTD) sales for each country based on the provided table:
| Country | Sales | Date |
|---|---|---|
| Italy | 3 | 02/02/2023 |
| Italy | 4 | 15/04/2023 |
| Italy | 5 | 02/07/2023 |
| Spain | 1 | 12/03/2023 |
| Spain | 2 | 28/03/2023 |
| Spain | 3 | 05/05/2023 |
To calculate the YTD sales, we need the cumulative sum of sales for each country. We’ll achieve this by creating a new column called “Self” using Table.AddColumn, which will store the rows that satisfy the condition each [Country] = Outside[Country] and [Date] <= Outside[Date]. Here’s the M code to achieve this:

The M code that we are using is:
Table.AddColumn(#"Changed Type", "Self", (Outside) => Table.SelectRows(#"Changed Type", each [Country] = Outside[Country] and [Date] <= Outside[Date]))- Table.AddColumn(#”Changed Type”, “Self”, …): This function adds a new column called “Self” to the table represented by #”Changed Type”. It takes three arguments: the table reference, the name of the new column, and an expression that defines the values of the new column.
- (Outside) => …: This is a lambda function or an anonymous function that takes an argument called “Outside”. Now, since the Table.AddColumn acts as an iterator, the (Outside) parameter will contain the full table filtered by the current row that is iterating.

When creating the “Self” column for the first row, (Outside) will be the green row that you see from the screenshot. Instead, when creating the second row of the “Self” column, (Outside) will be the blue row, and so on and so forth.
The advantage of this is that we can then use the values of Country and Date of the current row to perform the logical condition.
- Table.SelectRows(#”Changed Type”, …): This function filters rows from the table #”Changed Type”. It takes two arguments: the table reference and a condition that specifies which rows to select.
- each [Country] = Outside[Country] and [Date] <= Outside[Date]: This is the condition used to filter rows.
It’s in this step that we take advantage of the second step. As discussed in the second step, thanks to (Outside) we have the information of the row that we are currently in during the iteration. Now, the table #”Changed Type” contains all the rows, so we use (Outside) to filter it.
For example, when during the iteration we find ourselves at the red row, the logic condition of each [Country] = Outside[Country] and [Date] <= Outside[Date] will return:

Because it satisfies the condition each [Country] = Italy and [Date] <= “02/07/2023”.
Finally, for every row of the original table, we get, in the new “Self” column, one or more rows that satisfy the condition each [Country] = Outside[Country] and [Date] <= Outside[Date].

Next, we need to aggregate the data in the “Self” column to obtain the cumulative sales for each country. We achieve this using the Table.AggregateTableColumn function as follows:

The M code that we are using is:
Table.AggregateTableColumn(SelfJoin, "Self", {{"Sales", List.Sum, "Cumulative Sales"}})- Table.AggregateTableColumn(SelfJoin, “Self”, …): This function is used to aggregate data in the specified table column. It takes three arguments: the table reference, the name of the column to be aggregated (“Self” in this case), and an aggregation specification.
- {{“Sales”, List.Sum, “Cumulative Sales”}}: This is the aggregation specification. It specifies how the “Sales” values in the “Self” column should be aggregated. It uses a list format, where each element in the list contains three pieces of information: the column name (“Sales”), the aggregation function (List.Sum, which calculates the sum of “Sales” values), and the name of the newly aggregated column (“Cumulative Sales”).
In conclusion, by using Table.AddColumn and Table.SelectRows functions in M, we can overcome the limitations of the Power Query UI and perform joins with logic conditions like less than or equal to in Power Query.


