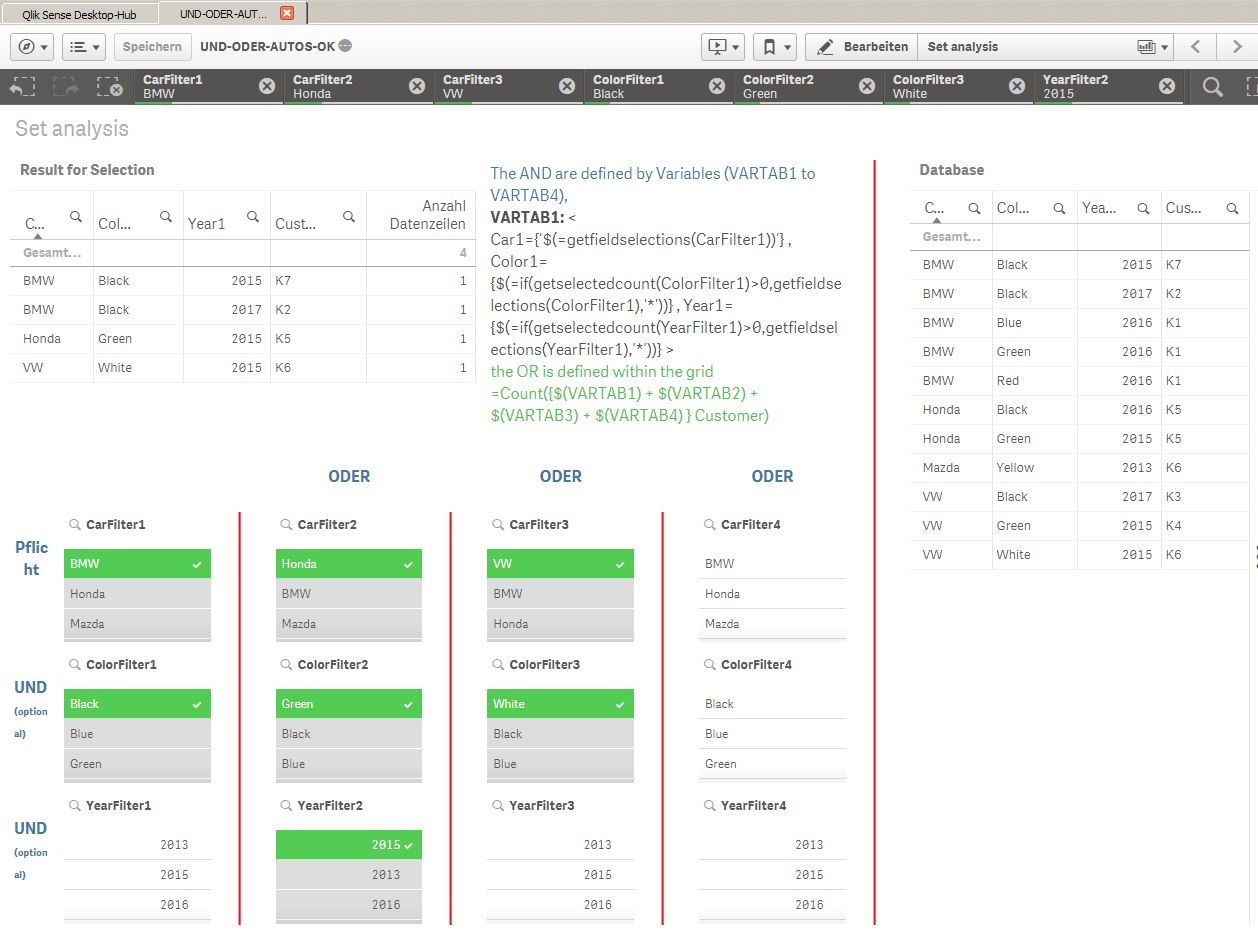
The constant comparison between Power BI and Qlik Sense, much like the perpetual Samsung vs Apple debate, is evident. One of the primary features that sets these two apart is that Qlik Sense presents the selected values at the top of the page, as can be seen in the provided image:
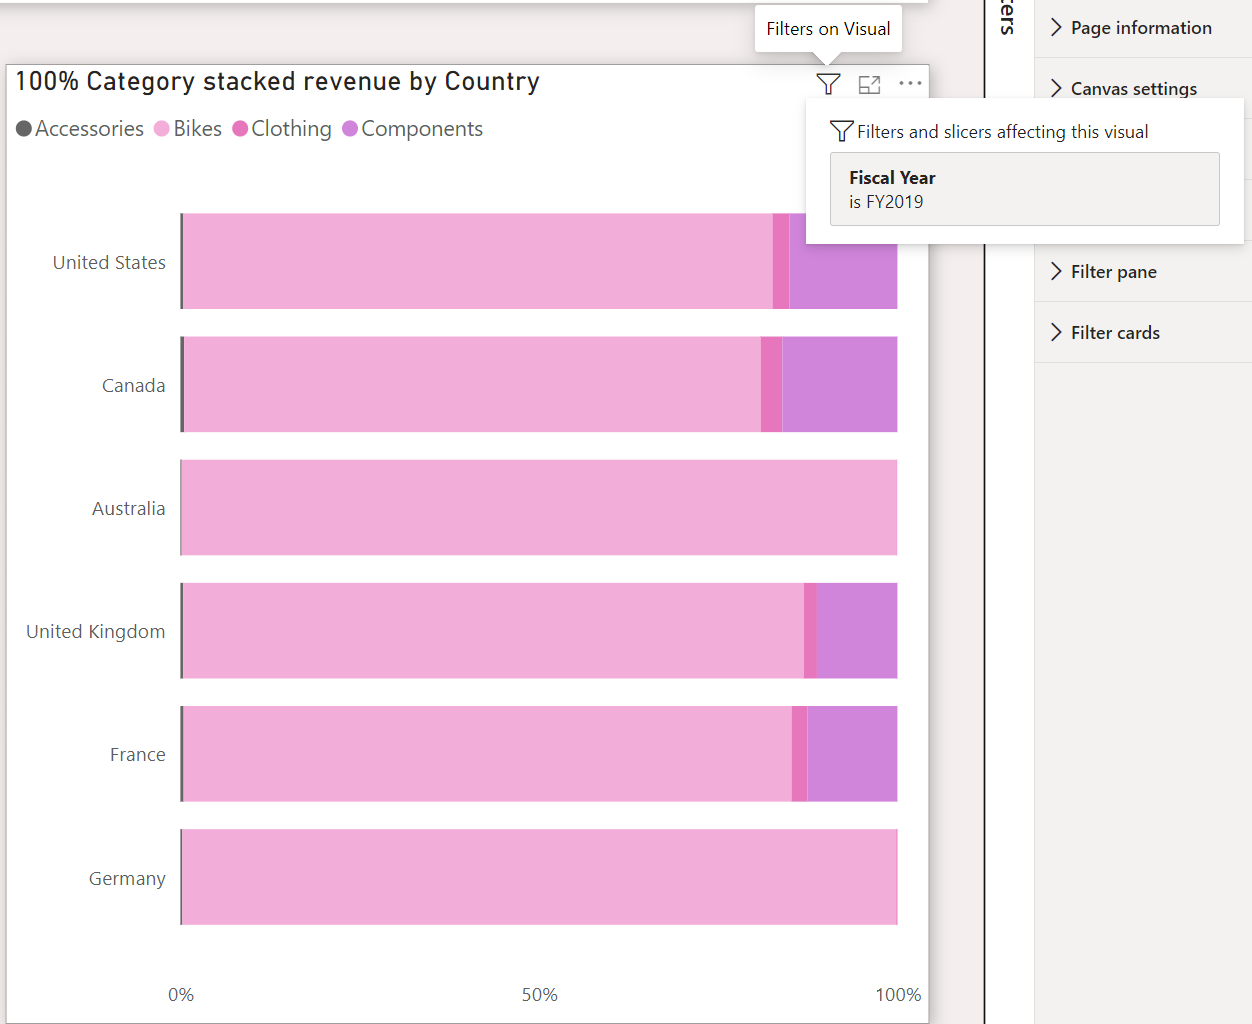
However, in Power BI Desktop, you need to hover your mouse over a visual to reveal the filters applied to that visual:
Business users often prefer to see their selected values while navigating the page. It could become tedious having to hover over each visual on the page. Hence, we found a solution: the creation of measures.
By leveraging measures, we can showcase the selected values by using the CONCATENATEX() DAX function. These measures can then be used in a matrix as shown:

Note: we have configured this Matrix to “switch values to rows” .
When a user picks values from a Slicer, these selected values will appear in the matrix. Conversely, if no selection has been made, these measures simply display “All values”, as shown:

Here is the DAX code used to create these measures:
Selected Country =
VAR vOutputText =
CONCATENATEX(
    VALUES('Sales Territory'[Country]),
    'Sales Territory'[Country], ", ")
VAR Result =
IF( ISFILTERED('Sales Territory'[Country]) , vOutputText, "All Country")
Return
Result
The VAR keyword is used to define a local variable within the measure. There are two variables used in this measure: vOutputText and Result.
- vOutputText – This uses the CONCATENATEX function, which concatenates the values from the ‘Sales Territory'[Country] field. The VALUES function returns a one-column table that contains the distinct values from the specified column, in this case, ‘Sales Territory'[Country]. The resulting values are separated by commas.
- Result – This uses the IF and ISFILTERED functions. The ISFILTERED function checks if ‘Sales Territory'[Country] column is filtered or not. If it is filtered (i.e., one or more countries have been selected), then vOutputText (the list of selected countries) is returned. If it is not filtered (i.e., no countries have been selected), then the string “All Country” is returned.
The Return statement at the end indicates the final result of the measure which, in this case, is the Result variable.
So, in simple terms, this DAX code creates a measure that gives you a comma-separated list of selected countries if there are any, otherwise it displays “All Country“.
However, as one might predict, the drawback of this method is the need for a measure for each column where we aim to exhibit the selected values.
To counter this, we’ve written a simple C# code that can be utilized in the Tabular Editor. This script generates the measures for every column you select. Here’s a step-by-step guide on how to use this code:
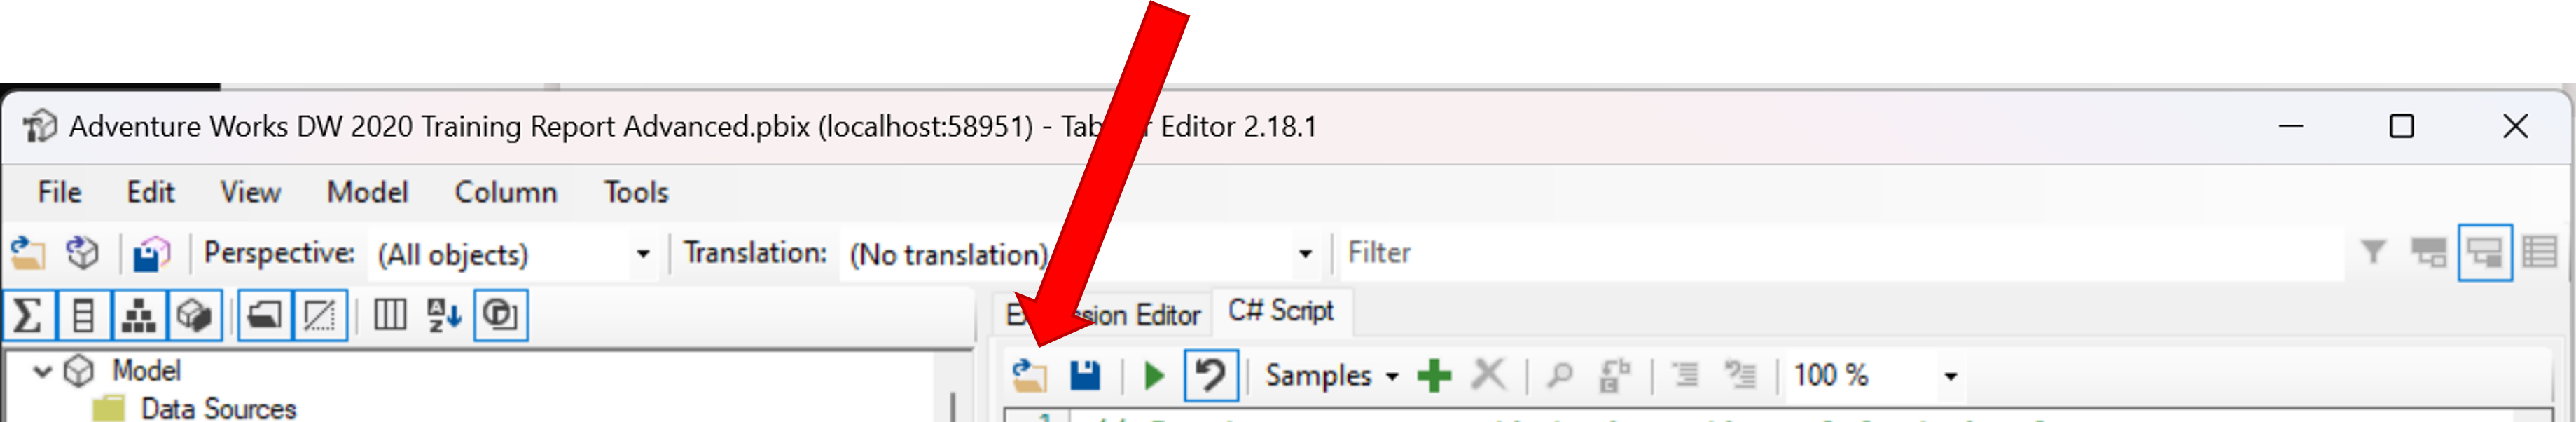
- Launch Tabular Editor.
- Connect to your cube or Power BI report.
- Open the C# tab and select “Open”, or copy the C# code at the end of this article.
- Choose the columns for which you wish to generate measures. Note: Multiple columns can be selected simultaneously if they are in the same table.
- Click “Run”.
This action will create a folder and the necessary measures. Be aware that the measures created by this script are hidden by default. Therefore, you may need to enable “View hidden” in Power BI Desktop to view them.
This is the C# code so you can copy/paste it:
// Creates a measure that shows the selelected values.
foreach(var c in Selected.Columns)
{
    var newMeasure = c.Table.AddMeasure(
        "Selected " + c.Name,                    // Name
        "\nVAR vOutputText = \nCONCATENATEX(\n    VALUES(" + c.DaxObjectFullName + "),\n    " + c.DaxObjectFullName + ", \", \") \nVAR Result =  \nIF( ISFILTERED(" + c.DaxObjectFullName + ") , vOutputText, \"All "+ c.Name +"\") \nReturn \nResult",    // DAX expression
        c.DisplayFolder
    );

    // Provide some documentation:
    newMeasure.Description = "This measure shows the selected values of " + c.DaxObjectFullName;

    //Change the folder name
    newMeasure.DisplayFolder = "Values selection";                       // Display Folder

    // Hide the measure:
    newMeasure.IsHidden = true;
}


